


Member portal daily kilowatt hour energy use with daily low temperature overlay
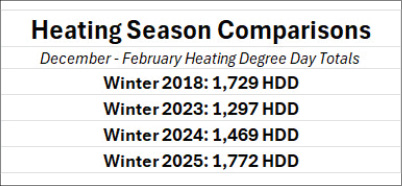
Tidelanders, while we have talked about January 2025 being the 2nd coldest January in over 3 decades (January 2018 was the coldest) we can now look back on the 2025 heating season as a whole. When we combine the heating degree days from December through February you can see the need for home heating this winter outpaced that of 2018.

Ecobee runtime dashboard for air source heat pump with auxiliary heat strips
This year we had two major cold events: the January snowfall followed by February’s ice storm. That means you likely experienced back-to-back electric bills that were higher than usual.
If you have an air source heat pump with auxiliary heat strips you probably took a bit of a hard hit this winter.
Below is a chart of a member’s daily kilowatt hour consumption between Nov. 1 and March 7. The blue line represents the day’s lowest outdoor temperature reading (this particular chart is for New Bern). The lowest during this time period was 16°F on the morning of Jan. 23.
The black line across the page represents 40°F. During that 127-day period, 64 of those days saw outdoor temperatures fall below 40°F. Why is this significant?
Because that is the point at which normal auxiliary heat operation may have factored into your daily energy consumption. When auxiliary heat is operating your hourly operating costs can triple from that of the much more efficient operation involving just the heat pump compressor. While we frequently talk about heating degree days as a measure of fluctuating home heating costs, it is important to understand when and how your auxiliary heat engages.
What can you do to better manage auxiliary heat?
If you have an outdoor thermostat that is preset at 40°F you can ask your HVAC tech to lower it and test performance and comfort at a setting of maybe 35°F.
If you have a WiFi-enabled smart thermostat, like the Ecobee, you can test the auxiliary heat threshold on your own. If you do have a WiFi-enabled smart thermostat and an online dashboard is available, log in to see your system runtimes which should include the mode of operation such as Stage 1, Stage 2, Auxiliary, etc. You can then do a side-by-side comparison with your Tideland EMC member portal data to better understand how much your HVAC system contributes to your energy consumption.
Combine those two things with a high energy use alert and you should have all the tools you need to avoid unpleasant winter heating surprises.
Calibrate your Ecobee thermostat
For making adjustments to your Ecobee thermostat, follow these simple steps.
More stories like this

WPCA charge returns to bills earlier than anticipated
A message to members from Paul Spruill, General Manager & CEO

Save while away

July right-of-way maintenance schedule
